Prof. Jonathan Cervas
Updated: September 16, 2026
Professor Jonathan Cervas
Office: Posner Hall 374
Email: cervas@cmu.edu
Location: Porter Hall A21A
Time: Tuesday & Thursday 11:00a-12:20p Eastern
Office Hours: Wed 10:30a-12:30p & 1:30p-3:30p, and by appointment (arrange via email)
CMU Academic Calendar
The most up-to-date version of this syllabus can be found here.
Course Relevance: DC: Perspectives on Justice and Injustice Learning Resources: All resources will be provided via Canvas
Prerequisites: 36-200 Reasoning with Data
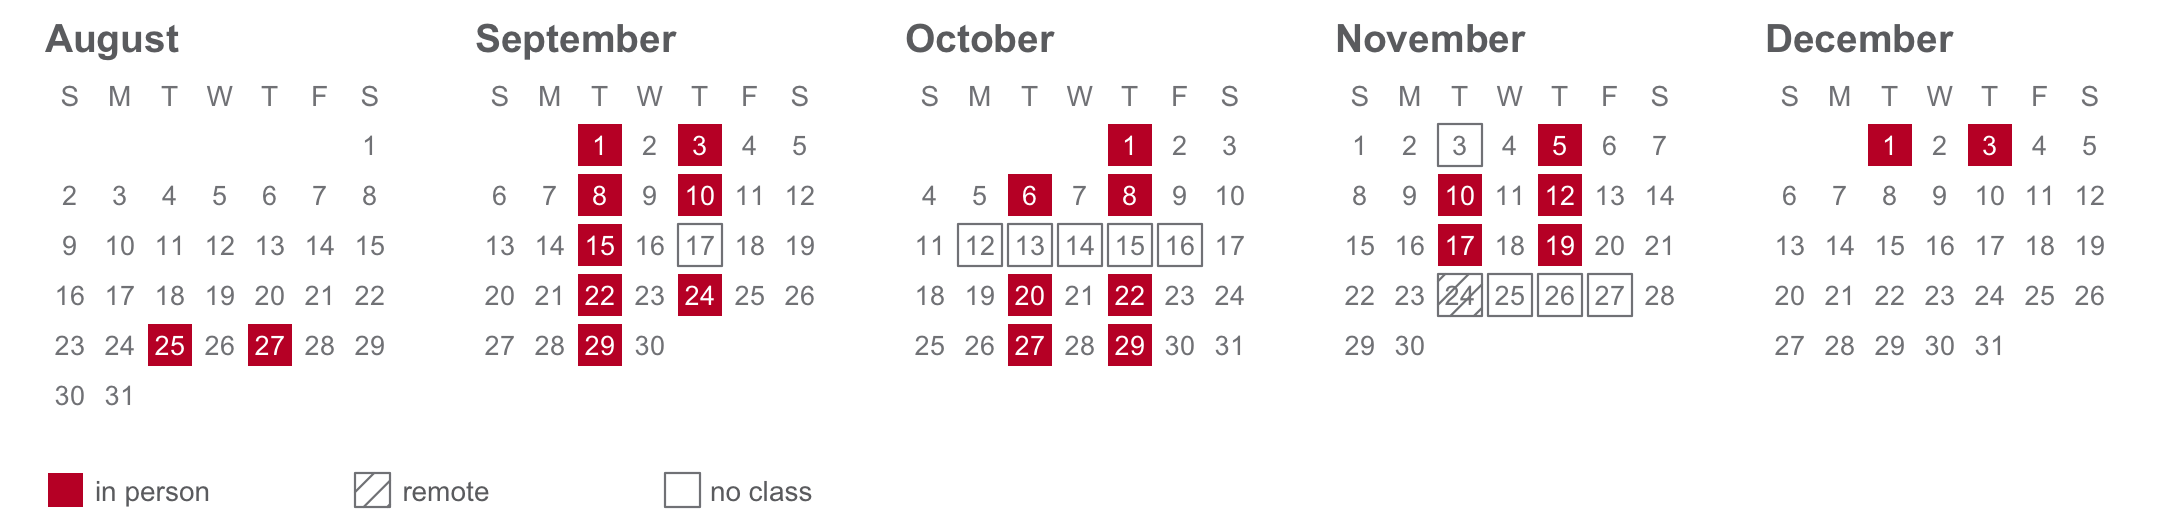
25 meetings, Tuesdays and Thursdays. One of them, Tue, Nov 24, meets on Zoom rather than in the room. Tinted days are ones we do not meet — fall break, Democracy Day, Thanksgiving, and the Constitution Day Symposium.
Course Description
The point of this course is to understand the political world — particularly through the data it produces. American elections generate an enormous amount of it: vote returns reaching back to the nineteenth century, the census that decides how many seats each state gets, campaign finance filings, polls, roll-call votes, and the record of who turned out and who did not. Every one of those numbers was produced by somebody, for a purpose, and every one of them leaves something out.
We work with real data every week — 41 presidential elections since 1864, the apportionment that followed the 2020 census, FEC filings, congressional roll calls, Census and American Community Survey estimates, and the 2026 midterms as they happen.
This is a general education course and there is no coding prerequisite. Every data exercise we do arrives as a prepared data brief with the results already in front of you. What you are asked to do is read it closely, follow how the numbers were made, and explain what you are looking at. The skill being built is not programming; it is judgment about evidence. You will practice it on a data-driven news story written for real readers, and defend it in class every week.
Course Goals
This course has one central aim: that you leave able to look at a number about American democracy and know what to ask of it. Who produced it, what it counts, what it leaves out, and whether it supports the claim being made in its name.
Everything else — the readings, the labs, the project — serves that.
Learning Objectives
By the end of the semester you will be able to:
- Explain where American election data comes from — who produces it, at what geographic level, and what each source does and does not capture. (Parts I and III)
- Read a table, chart, or map of electoral data and say plainly what it shows, what it does not show, and what would have to be true for its conclusion to hold. (every part; this is the core skill)
- Test a claim about elections against the underlying data — whether the claim comes from a news story, a campaign, or a scholarly argument. (Parts II and III)
- Explain the institutions that convert votes into power: the Electoral College, apportionment, districting, and the Voting Rights Act. (Parts I and III)
- Recognize when a number misleads — through selective framing, mismatched units of analysis, or a model that gets the right answer for the wrong reason. (every part)
- Write about quantitative evidence for a non-technical audience — in journalistic form at length, and briefly every week on the discussion board. (the data journalism project; the board)
Required Text
John Sides, Daron Shaw, Matt Grossmann & Keena Lipsitz. Campaigns and Elections. New York: W. W. Norton. ISBN 978-1-324-11504-5.
Readings from the text provide the context for each week. Expect to read one or two chapters before Tuesday, when we discuss it, and to spend Thursday working with data — the slides you brought, then the lab. Chapters are short — budget about an hour.
There is nothing else to buy.
Current events
The textbook is the context; the news provides content. A chapter is settled by the time it prints, and this one went to press before the campaign you are living through.
So most weeks carry one or two short current-events items alongside the chapter — an article, an interactive, a newsletter post, sometimes a podcast. They are listed in the schedule. They are not optional: they are usually what Tuesday actually argues about, because they are where the chapter’s claim either holds up or does not.
Expect additions. A syllabus written in August cannot know what November will produce. If the schedule and Canvas disagree, Canvas is right.
Current events are also where your weekly data slide comes from. You are not expected to go hunting in unfamiliar places. The sources below are valuable resources, but you can find other things as well.
| Worth following all term | |
|---|---|
| General | New York Times (especially The Upshot), Washington Post, Wall Street Journal — all three are free to you through the CMU Libraries |
| Elections specialists | Bolts, Votebeat, Stateline, Democracy Docket, Cook Political Report, Sabato’s Crystal Ball |
| The census | Count of Counting — Mike Schneider, who covered the Census Bureau for the Associated Press, on population change and the count itself |
| Data and forecasting | Strength In Numbers (G. Elliott Morris), Silver Bulletin, Split Ticket, The Downballot, Playing with Election Data (Charles Stewart) |
| Podcasts | The Ezra Klein Show (NYT) · NPR Politics Podcast · The Downballot (weekly, Thursdays) · Amicus (Slate) · Public Opinion Podcast (AAPOR) |
What you need
This is not a programming course, and there is no coding prerequisite.
There is no software to install and nothing to set up. Every data exercise or example arrives as a prepared data brief — the source, the decisions behind it, and the figures already made — and your job is to read it, follow how the numbers were built, and above all explain what you are looking at. If you have never worked with data before, you are exactly who these are written for.
Bring a laptop to Thursday sessions if you have one; the briefs are web pages and they read well on a phone or on paper too. If you would rather work from a printout, say so and I will bring one.
How This Course Works
Two things run side by side. One is the textbook: how campaigns and elections work, read straight through from Chapter 1 to Chapter 13. The other is the data — where the numbers about American politics come from, who produced them and why, and what they can and cannot tell you. Generally speaking, Tuesday is the book. Thursday is the data.
The two are not synchronized, and are not meant to be. The textbook keeps its own order, and the three tests cover it and nothing else. The data sessions run their own sequence, below.
| When | What |
|---|---|
| Before Tuesday | Read the week’s chapter — about an hour. |
| Tuesday, in class | The chapter, and the question it raises. |
| Before Thursday | Post a data slide bearing on the question we ended Tuesday with. |
| Thursday, in class | Two of your slides, then the lab. |
| By Friday, 11:59 p.m. | One post to the discussion board about any data we looked at that week. |
The data sessions
Eleven sessions in three parts, and the parts are a claim about who collected the data and why. The state enumerates, and you are required to answer (I). Somebody asks, and you answer because you feel like it (II). Then an election happens, and Part III is everything it leaves behind — the result certified, the machinery administered, a donation disclosed because a statute compels it, a voter file nobody volunteered for, and, where nobody collected anything, a number a researcher built.
| Pt | Sessions | |
|---|---|---|
| I | The Census Bureau | 1–3 |
| II | Surveys | 4–5 |
| III | Elections, and the records around them | 6–11 |
Assessment
The course grade will be a weighted average of the following components:
| Category | Percent of Final Grade |
|---|---|
| Participation & Attendance | 23% |
| Discussion Board | 10% |
| Surveys (3, completion only) | 2% |
| Data Slides | 10% |
| Three Tests (10% each) | 30% |
| Data Journalism Project | 25% |
Full instructions for every assignment are in Canvas, under Assignments. What each one is, in the order of the table above:
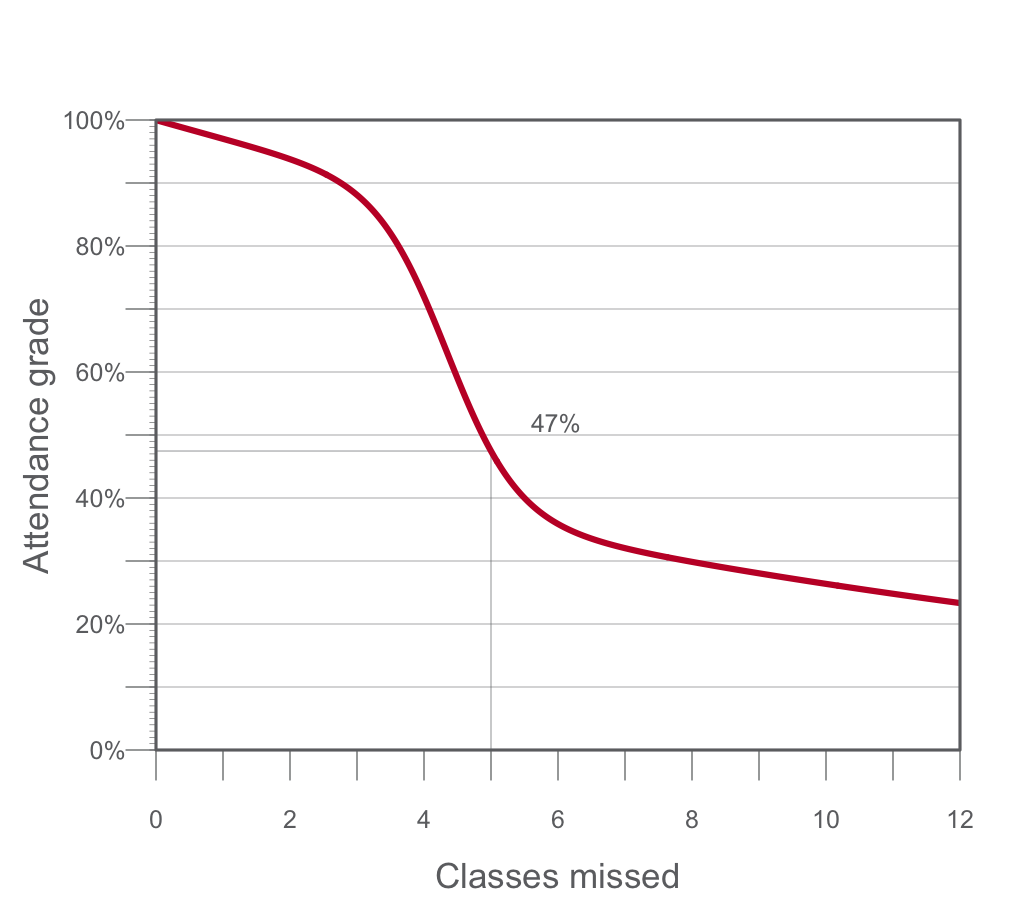
- Participation & Attendance — Being here, prepared, and in the conversation — on both days. The first three absences cost almost nothing; four to six is where a semester goes wrong.
- Discussion Board — By Friday, 11:59 p.m. each week, one post about any of the data we talked about: the lab, a classmate’s data slide, a figure in the reading. Something that surprised you, something we missed, something you do not understand, or an answer to somebody else’s question. A few sentences to a paragraph — enough to show you engaged with what we did. Marked complete/incomplete, and one post is full credit.
- Surveys — Three short ones: the Cervas Election Study on Wed, Aug 26, a midterm feedback survey on Fri, Oct 23, once you have seen how the course actually runs, and the course evaluation in the final week. All three are anonymous and graded for completion only — there are no right answers, and nothing you say affects any other part of your grade. Because they are anonymous, screenshot the confirmation screen and upload that for credit.
- Data Slides — Find data bearing on the question Tuesday ended with and post it before Thursday as an infographic with a short write-up: the figure itself, the source named and linked, and a few sentences on what the data say and mean. Each week two slides are drawn at random and worked through in class, and nobody presents the data they found themselves — expect your own data to come up once or twice all term. The slide is marked complete or incomplete each week. At the end of term you hand in a newsletter: every piece of data you found, each with a short write-up. Build it as you go — it is a paragraph a week, and an evening’s work if you leave it all to December. The weekly slides are 90% of this component; the newsletter is the other 10%.
- Three Tests — In class, on paper, and on the textbook only. Test 1 on Thu, Oct 8 (Sides et al., Chapters 1–5), Test 2 on Tue, Nov 10 (Chapters 6–9), Test 3 on Thu, Dec 3 (Chapters 10–13). We read the book straight through in its own order, so each test is a block of consecutive chapters: each covers the chapters read since the last one, none is cumulative, and every chapter appears on exactly one test. There is no final exam.
- Data Journalism Project — A data-driven news story about a trend or issue in electoral processes: 2–4 pages single spaced, with at least two figures. It is the only substantial piece of writing this term. A pitch (5%), a draft (50%), the two peer reviews you write (35%), and the final (10%) — most of the marks are on the draft and the reviews, and you cannot rescue a missing draft with a good final.
Due Dates
| Assignment | Due |
|---|---|
| Data slide | before each Thursday |
| Surveys (3) | Wed, Aug 26 (Cervas Election Study), Fri, Oct 23 (midterm feedback), final week (course evaluation) |
| Discussion board post | Friday, 11:59 p.m., each week |
| Week 4 board post (no Thursday class) | Wed, Sep 16 — day after the Tue Sep 15 class; Thu Sep 17 is Constitution Day, no class |
| Week 14 board post (Thanksgiving) | Wed, Nov 25 — day after the Tue Nov 24 Zoom class; Thu Nov 26 is Thanksgiving, no class |
| Test 1 — Ch. 1–5 | Thu, Oct 8, in class |
| Data journalism: pitch | Tue, Oct 20, in class |
| Test 2 — Ch. 6–9 | Tue, Nov 10, in class |
| Data journalism: draft | Thu, Nov 19 — the term’s last data session |
| Data journalism: peer reviews (two) | Tue, Dec 1 |
| Test 3 — Ch. 10–13 | Thu, Dec 3, in class |
| Data newsletter | Tue, Dec 8 |
| Data journalism: final | Fri, Dec 11 — after the last session |
There is no final exam.
Grading
Your grade rests on engagement as much as on output. The course is built around two things happening every week — you arriving having read, and you arriving having found data — and neither can be made up afterwards.
Deadlines. You are expected to meet them. If you can see in advance that you will not, contact me before the due date and we will sort something out.
Late work loses one percentage point per hour, and never falls below 50%.1 Canvas applies this automatically. Submit what you have rather than polishing something that is already late.
Work that is never submitted scores zero, which is the whole reason the late floor sits at 50%: handing something in a week late is always worth more than handing in nothing.
Two things sit outside that rule because being late breaks somebody else’s work, not just your own:
- Peer reviews. Your classmate cannot revise against a review that has not arrived. Late reviews are marked down sharply.
- Project drafts. A missing draft means two people have nothing to review, and — as above — you cannot rescue a missing draft with a good final.
Schedule
Week 1 — Part I opens
Tue, Aug 25 — Course introduction: the three parts. Read the book’s own introduction, What This Book Is For.
- The book’s introduction — What This Book Is For
- DUE Wed, Aug 26, 11:59 p.m. — the “Cervas” Election Study.
Thu, Aug 27 — Data Session 1 — The decennial census, and the seats it decides
- Census Bureau, America Counts: 250 Years
- Census Academy — the Census data API — module 1 only
- NCSL, Redistricting Law 2020, ch. 1 — the census
- Optional: Anderson & Fienberg, Who Counts? The Politics of Census-Taking in Contemporary America (Russell Sage, 1999) — the 1990 count missed poor and minority city residents, the Bureau knew by how much, and the fight over whether to correct the number went to lawsuits, congressional hearings, and the Supreme Court. It is a book; the Introduction is the part to read. Fienberg wrote it while he was CMU’s Maurice Falk University Professor of Statistics and Social Science.
- Optional: NYT — the administration’s proposed rewrite of the 2030 census — the Census Bureau submitted a proposed rule in September 2026 that would count citizens and lawful permanent residents and leave everyone else out, including refugees, asylum seekers and people with temporary legal status, and would drop the race and ethnicity questions. Both halves bear on this session: the Fourteenth Amendment apportions seats by the “whole number of persons in each State,” and the race questions are the ones we spend a later session taking apart. Nothing is settled — it is a proposal, and the first Trump term’s version of it lost in court.
Week 2 — Part I
Tue, Sep 1 — The rules, and the four standards
- Sides et al., Ch. 1
- Scott, Seeing Like a State (1998), intro — where “legibility” comes from
Thu, Sep 3 — Data Session 2 — Geography, and the scales it comes at
Week 3 — Part I
Tue, Sep 8 — Who can vote, how, and where
- Sides et al., Ch. 2
- Cohn, NYT — the Electoral College edge
- Brennan Center — census data and a changing nation
- NPR — Black representation after the ruling
- Podcast: Amicus (Slate) — “This Was the Roberts Court’s Most Shameless Term Yet,” July 11, 2026
Thu, Sep 10 — Data Session 3 — The American Community Survey
- ACS Handbook, ch. 1 — the basics
- Census Academy — Discovering the American Community Survey — all six modules
- Slides and transcripts for all six modules — on Canvas, if you would rather read than watch: every slide from each recording, lined up against what is said over it
Week 4 — Part II opens
Tue, Sep 15 — The transformation of American campaigns
- Sides et al., Ch. 3
Thu, Sep 17 — NO CLASS. Constitution Day Symposium.
- You are expected to attend, at least during our normal class hours. CMU Constitution Day Symposium — Simmons Auditorium, Tepper. Free, but registration closes Wed, Sep 10.
- Pew — how public polling has changed
- Pew — polling basics, lessons 1–3
Week 5 — Part II
Tue, Sep 22 — Money, and the rule that shapes everything after it
- Sides et al., Ch. 4
Thu, Sep 24 — Data Session 4 — Election polls: the horse race, and what a margin hides
- Bailey, Polling at a Crossroads (2024), ch. 1, 3–22 — the library’s online copy; sign in with your Andrew ID
- NYT — are political polls accurate?
- NYT — election polls, confusion, and prediction markets
- Podcast: AAPOR’s Public Opinion Podcast — “Perspectives on Political Polling,” March 14, 2025 — scroll the page to find it
Week 6 — Part II closes
Tue, Sep 29 — Strategy: who a campaign decides to talk to
- Sabino, Bolts — Missouri’s ballot-initiative vote
- Sides et al., Ch. 5
Thu, Oct 1 — Data Session 5 — Public opinion, and the studies built to measure it: the “Cervas” Election Study beside CES and ANES.
- Verba, “The Citizen as Respondent” (1996), 1–7 — why measure opinion by survey at all
- Pew — writing survey questions — wording, order effects, response options
- Reference: Cooperative Election Study — how it samples, and how many it reaches
- Reference: American National Election Studies — the same two questions, answered differently
- Reference: Harvard Youth Poll, 52nd edition — toplines, and the methodology behind them
Week 7 — Test 1
Tue, Oct 6 — Who the electorate is. No new chapter — review Ch. 1–5; Test 1 is Thursday.
- No new chapter — review Ch. 1–5 for Test 1
- NYT — the rise of the multiracial right
Thu, Oct 8 — TEST 1. In class, on paper — Ch. 1–5
- Nothing new — bring questions
Week 8 — FALL BREAK, no class (Oct 12–16) Test 1 is behind you. Nothing is due.
Week 9 — Part III opens
Tue, Oct 20 — Data Session 6 — Part III opens: what a return is, where you get one, and what forty of them show
- Burness, Bolts — election data and voting rights
- FairVote — Monopoly Politics 2026
- DUE: Data journalism story — pitch your topic (one paragraph, in class).
Thu, Oct 22 — Data Session 7 — The bottom rungs: precincts and ballots
- MIT Election Lab — why does anyone need precinct-level results? — what county totals lose, and why the boundaries move
- DUE Fri, Oct 23, 11:59 p.m. — the mid-term course feedback survey.
Week 10 — Part III
Tue, Oct 27 — Parties and interest groups
- Sides et al., Ch. 6 and Ch. 7
Thu, Oct 29 — Data Session 8 — Money in politics: the record, and the hole in it
- OpenSecrets — dark money basics — who must name a donor, and who need not
- NYT — Harris’s donors, the graphics — a disclosure file, drawn
- NYT — Trump’s campaign-finance disclosures — the same instrument as a problem
- Podcast: The Downballot — “How Democratic ‘spam PACs’ victimize vulnerable seniors,” September 3, 2026
Week 11 — Part III · election night
Tue, Nov 3 — NO CLASS. Democracy Day. Read both chapters this week, for Thursday.
- For Thursday: Sides et al., Ch. 8 and Ch. 9
Thu, Nov 5 — Fixed date. Data Session 9 — Live returns. Built on results that do not exist until Nov 3.
Week 12 — Part III · the machinery
Tue, Nov 10 — TEST 2. In class, on paper — Ch. 6–9
Thu, Nov 12 — Data Session 10 — Surnames and geolocation: guessing race from a name and an address
- CFPB — Using publicly available information to proxy for unidentified race and ethnicity — sections 1–5 (pp. 3–23), stopping before the technical appendices. A federal agency explaining how it guesses your race from your surname and your address, because the law forbids it from asking — and then, in section 4, checking the guess against mortgage applicants whose race is on record.
- Rosenman, Olivella & Imai — Race and ethnicity data for first, middle, and surnames — read the Background & Summary and the description of the data; the validation is heavier going. Where the name dictionaries come from: the voter files of the six Southern states that ask you your race when you register.
- Optional: Fahey, “Data Federalism,” Harvard Law Review 135 (2022): 1007 — governments find it easier to get data about you from each other than to collect it themselves; election management is one of the markets she traces. Long; the Introduction is the part to read.
Week 13 — Part III
Tue, Nov 17 — Congressional, state and local campaigns
- Sides et al., Ch. 10 and Ch. 11
- Morris — the hidden axis
Thu, Nov 19 — Data Session 11 — Racially polarized voting, and what the Voting Rights Act asks the data to prove
- Li, Brennan Center — Section 2 of the Voting Rights Act at the Supreme Court — start here: what a Section 2 claim has to prove, worked through Alabama’s congressional map. Read the 4/29/26 update box at the top first: the article beneath it was written while Callais was still pending.
- CRS — High Court Narrows Voting Rights Act in Louisiana v. Callais — eight pages. The three Gingles preconditions, then what the April 2026 ruling did to each: an illustrative map now has to meet the state’s partisan goals as well as its traditional ones, and racially polarized voting has to be shown to be something party affiliation cannot explain. Louisiana’s challengers lost on exactly that point.
- Michigan Law Voting Rights Initiative — findings — a dataset built by reading 466 Section 2 opinions since 1982. Plaintiff success fell from 67% in the first decade to 34% after it.
- Optional background: NCSL, Redistricting Law 2020, ch. 3 — racial and language minorities — pp. 53–60, the Gingles preconditions as they stood before Callais. The same volume as Session 1, asked a very different question.
- DUE: data journalism draft.
Week 14 — the last two chapters
Tue, Nov 24 — Remote. The last two chapters — who turns out, and how they choose. On Zoom. No data session, no slide.
- Sides et al., Ch. 12 and Ch. 13 — both on Test 3
- Source your own: a news piece quoting a margin of error, or a demographic estimate
Thu, Nov 26 — NO CLASS. Thanksgiving. Nothing is due.
Week 15 — Part III, and the end
Tue, Dec 1 — The end of the argument — the law, the maps, and whether the thing itself can be measured.
- Moynihan — Power, Democracy and Clarity — the Court’s voting-rights turn after Callais
- Monmonier, Drawing the Line, ch. 5 — borrow from the Internet Archive
- NYT — gerrymandered districts aren’t always ugly
- Two ballot measures: California Prop 50 (passed), and Virginia (passed, then voided)
- V-Dem — scoring democracy itself, for every country, every year
- DUE: peer reviews of the data journalism draft — two each.
Thu, Dec 3 — TEST 3. In class, on paper — Ch. 10–13, then the course wrap
- Nothing to read — bring questions
Finals period — there is no exam.
DUE Tue, Dec 8 — the data newsletter.
DUE Fri, Dec 11 — data journalism story, final version.
AI Use Policy for Student Work
As artificial intelligence (AI) tools become increasingly accessible, it is important to clarify expectations for their use in this course. You are welcome to use AI technologies (such as ChatGPT, Grammarly, or similar tools) to support your independent work—such as brainstorming ideas, checking grammar, or improving the clarity of your writing. However, you may not use AI to generate substantive content that you submit as your own original work. All assignments, essays, and projects must reflect your own analysis, critical thinking, and voice.
Permitted Uses of AI:
- Outlining or organizing your thoughts
- Checking grammar, spelling, or clarity
- Generating ideas or prompts to help you get started
- Reviewing your own drafts for readability
Prohibited Uses of AI:
- Submitting AI-generated essays, paragraphs, or answers as your own work
- Using AI to complete assignments, discussion posts, or projects in place of your own effort
- Copying and pasting AI-generated content without substantial revision and personal input
If you use AI tools in your process, you must disclose how you used them in a brief note at the end of your assignment (e.g., “I used ChatGPT to help brainstorm ideas for my outline.”).
Violations: Submitting AI-generated content as your own is considered academic dishonesty and will be treated as a violation of the university’s academic integrity policy.
If you have questions about what is or is not allowed, please ask before submitting your work.
Representation Statement
I am committed to including a broad range of perspectives in the readings and materials for this course. If you believe a critical voice is missing, please let me know so I can improve the syllabus now and in future offerings.
We must treat every individual with respect. We come from many different backgrounds, and this variety of viewpoints is fundamental to building and maintaining an equitable and inclusive campus community. “Representation” can refer to the ways we identify ourselves—race, color, national origin, language, sex, disability, age, sexual orientation, gender identity, religion, creed, ancestry, belief, veteran status, or genetic information, among others. Each of these identities shapes the perspectives our students, faculty, and staff bring to campus. Promoting these varied viewpoints not only fuels excellence and innovation but also advances the pursuit of justice. We acknowledge our imperfections while fully committing to the work—inside and outside our classrooms—of building and sustaining a campus community that embraces these core values.
Each of us is responsible for creating a safer, more inclusive environment.
Unfortunately, incidents of bias or discrimination do occur, whether intentional or unintentional. They contribute to an unwelcoming atmosphere for individuals and groups at the university. Therefore, the university encourages anyone who experiences or observes unfair or hostile treatment on the basis of identity to speak out for justice and seek support—either in the moment or afterward. You can share your experiences using the following resources:
- Ethics Reporting Hotline Submit an anonymous report by calling 844-587-0793 or visiting cmu.ethicspoint.com. All reports are documented and reviewed to determine whether further action is needed. Regardless of the incident type, the university will use your feedback to transform our campus climate into one that is more equitable and just.
Accommodations for Students with Disabilities
If you have a documented disability and an accommodations letter from the Office of Disability Resources, please discuss your needs with me as early in the semester as possible. I will work with you to ensure that accommodations are provided as appropriate. If you suspect you may have a disability and are not yet registered with the Office of Disability Resources, you can contact them at access@andrew.cmu.edu.
Student Well-Being
The past few years have been challenging. We are all under significant stress and uncertainty. I encourage you to find ways to move regularly, eat well, and reach out to your support system—or to me at cervas@cmu.edu—if you need help. We can all benefit from support during stressful times, and this semester is no exception.
As a student, you may experience a range of challenges that interfere with learning, such as strained relationships, increased anxiety, substance use, feeling down, difficulty concentrating, or lack of motivation. These mental health concerns or stressful events can diminish your academic performance and reduce your ability to participate in daily activities. CMU offers services that can help, and treatment does work. Learn more about confidential mental health services available on campus at:
- Counseling and Psychological Services: http://www.cmu.edu/counseling/ Phone (24/7): 412-268-2922
Please remember that support is always available—don’t hesitate to reach out.
-
An hour or two costs almost nothing; a day costs a letter grade. Charging by the hour rather than the day removes the cliff at midnight — being twenty minutes late should not cost the same as being twenty hours late. The floor is there so that late work is always worth more than no work. ↩